Case Study : Rape Cases Analysis
Country : India
Samples used are the reports of rape cases from 2016 to 2021 in Indian states and Union Territories
Abstract :
Analyzing rape cases reported in India is crucial for understanding patterns, identifying systemic failures and driving policy reforms to ensure justice and safety. With high underreporting and societal stigma, data-driven insights can help reveal gaps in law enforcement, judicial processes and victim support systems. Examining factors such as regional trends, conviction rates and yearly variations aids in developing more effective legal frameworks and prevention strategies. Furthermore, such analysis raises awareness, encourages institutional accountability and empowers advocacy efforts aimed at addressing gender-based violence. A comprehensive approach to studying these cases is essential to creating a safer, legally sound and legitimate society.
This study is being carried out with an objective to perform descriptive analytics and to create a prediction model for yearly reported cases going forward. Descriptive analysis is carried out by using Data Visualization in various plots/graphs. Machine learning models are the most accurate models used in prediction. The best approach to design a prediction model is to use a regressor algorithm. After much negotiation among various regressor algorithms linear regression has been opted to design the predictor. Time Series Analysis algorithm is also compared in the list.
Keywords : EDA ( Exploratory Data Analysis), Data Visualization, Predictive Analytics, Linear Regression ( Machine Learning Algorithm), Auto-Regressive Integrated Moving Average models ( Time Series Forecasting Algorithm).
INTRODUCTION

Rape as a crime is deeply intertwined with societal perceptions of gender, power and justice. In ancient civilizations like Babylon, Greece and Rome rape was often viewed as a crime against a woman’s male guardian rather than the woman herself, reflecting patriarchal norms that treated women as property. Laws such as the Code of Hammurabi imposed severe punishments, but primarily to uphold male honor rather than justice for the victim. In medieval Europe, rape was frequently addressed through forced marriages or financial compensation, with little consideration for the victim’s trauma. Colonial-era legal systems carried these biases forward, often excluding lower-class and enslaved women from legal protection as sexual violence against them was either ignored or condoned. During the 19th and early 20th centuries, feminist movements began advocating for stronger rape laws and recognition of marital rape, yet legal standards often required victims to prove violent physical resistance making convictions rare.
By the late 20th century significant legal reforms took place including the criminalization of marital rape, the introduction of rape shield laws to protect victims from character attacks in court and a shift towards recognizing psychological coercion as a factor in sexual violence. The 21st century has seen further progress particularly with global movements like #MeToo which have exposed systemic cover-ups and widespread sexual misconduct. Many countries have expanded the legal definition of consent recognizing that true consent must be affirmative and freely given rather than simply the absence of resistance. Digital evidence such as messages and recordings now plays a significant role in rape prosecutions yet deep-seated issues like victim blaming, underreporting and low conviction rates persist. While laws have evolved societal attitudes and systemic failures still hinder justice for many survivors making the fight against sexual violence an ongoing struggle.
Machine learning has been applied to the analysis of rape cases in various ways, including crime pattern recognition, legal outcome prediction and sentiment analysis of survivor testimonies. Researchers have used natural language processing (NLP) and clustering algorithms to analyze police reports and court documents, identifying trends in offender behavior, victim demographic, and location-based crime patterns. Over the years, Predictive models such as linear regressors, decision trees, support vector machines (SVMs) and deep learning have been employed to forecast case outcomes, including conviction rates and sentencing severity. Sentiment analysis techniques have also been used to examine survivor testimonies, social media discussions and news articles to understand public perception and the emotional impact of sexual violence. Additionally, machine learning has helped detect biases in judicial decisions, revealing disparities based on gender, race or socioeconomic status. In digital spaces, AI models have been used to identify predatory behavior in online chats and social media, aiding in the prevention of sexual violence.
However these applications face significant challenges, including data privacy concerns, biases in training data and ethical dilemmas when dealing with sensitive cases. While machine learning can enhance crime analysis and justice mechanisms, human oversight remains crucial to ensure fairness, accuracy and ethical integrity in legal contexts.
KEY CONCEPTS :
1. EDA ( Exploratory Data Analysis) :
Exploratory Data Analysis (EDA) is the process of analyzing and summarizing datasets to uncover patterns, detect anomalies and check assumptions before applying machine learning models. It involves statistical methods, data cleaning and feature engineering to better understand the data's structure.
2. Data Visualization:
The graphical representation of data using charts, graphs, and plots to make insights more understandable and accessible. Common techniques include histograms, scatter plots, box plots, heatmaps and bar charts which help in identifying trends, outliers and correlations.
Data visualization is considered an effective method for descriptive analysis as it helps translate complex datasets into easily interpretable visual representations allowing for quick insights and better decision-making. Unlike raw numbers and tables visualizations like bar charts, histograms, scatter plots and heatmaps highlight patterns, trends and relationships in the data making it easier to detect anomalies and correlations. Additionally, visual representations improve communication by making findings more accessible to non-technical stakeholders. They also enhance comparisons, distributions and summary statistics enabling analysts to understand data characteristics at a glance which makes descriptive analysis more intuitive, insightful and actionable.
Plots/Graphs of Interest :
(i). Line Plot : A line plot connects data points using a continuous line, showing trends over time or another continuous variable. It is commonly used for time series analysis, where the x-axis represents time and the y-axis represents the measured variable. Line plots help identify patterns such as trends, fluctuations, and seasonality.
(ii). Bar Plot: A bar plot (or bar chart) represents categorical data using rectangular bars. The length of each bar corresponds to the value of the category. Bar plots can be vertical or horizontal and are useful for comparing discrete groups or categories, such as sales by product type or population by region.
(iii). Heat Map: A heat map uses color gradients to represent data intensity, making it useful for visualizing correlation matrices, density distributions, or frequency counts. Darker or more intense colors usually indicate higher values, while lighter colors indicate lower values. It is often used in correlation analysis and spatial data visualization.
(iv). KDE (Kernel Density Estimation) Plot: A KDE plot is a smoothed version of a histogram that estimates the probability density function of a continuous variable. It helps visualize the distribution of data without the binning constraints of a histogram, making it useful for identifying skewness, peaks, and multimodal distributions.
(v). Box Plot: A box plot (or whisker plot) summarizes the distribution of a dataset by showing the minimum, first quartile (Q1), median (Q2), third quartile (Q3), and maximum. It highlights outliers and spread, making it useful for comparing distributions and detecting skewness or extreme values.
Python Libraries used to implement plots :
(i). Matplotlib : A foundational plotting library with common functions: plot() (line plot), bar() (bar plot), hist() (histogram), scatter() (scatter plot)
(ii). Seaborn: A data visualization library built on top of matplotlib which is used when more informative statistical visualizations should be implemented with less code. Common functions: lineplot(), barplot(), heatmap(), kdeplot(), boxplot()
3. Predictive Analytics:
Predictive analytics is a data-driven approach that uses historical data, statistical techniques and machine learning to forecast future outcomes or trends. By identifying patterns and relationships in data, it helps in anticipating future events, optimize decision-making and reduce risks.
Predictive analytics is valuable in analyzing reported rape cases as it helps identify patterns, trends and risk factors enabling proactive measures to prevent such crimes. By analyzing historical data, it can pinpoint high-risk areas, times or demographics, allowing law enforcement to allocate resources more effectively and improve response times. It also uncovers patterns related to victim and offender profiles, which can inform targeted interventions and awareness campaigns. Insights from predictive analytics can also guide policymakers in developing data-driven strategies to address systemic issues and enhance victim support services. This shifts the focus from reactive responses to prevention and resource optimization aiming to reduce the occurrence of such crimes and improve outcomes for victims.
4. Machine Learning Regressors :
ML regressors are algorithms or models used to predict a continuous numerical value based on input data. These models are part of supervised learning, where the goal is to learn a mapping from input features (independent variables) to a continuous target variable (dependent variable).
Key Characteristics of Regressors:
(i). Output: Predicts a continuous value (e.g., house prices, temperature, stock prices).
(ii). Training Data: Requires labeled data with input features and corresponding continuous target values.
(iii). Evaluation Metrics: Common metrics include Mean Squared Error (MSE), Mean Absolute Error (MAE), and R² (coefficient of determination).
Linear Regression algorithm is a type of Supervised Regressor algorithm.
Linear regression is a widely used machine learning algorithm for predicting a continuous target variable based on one or more input features. It assumes a linear relationship between the input variables (independent variables) and the target variable (dependent variable). The goal of the algorithm is to find the best-fitting straight line (or hyperplane in higher dimensions) that minimizes the error between the predicted and actual values.
For a single feature (simple linear regression):
y = mx + b
Here:
y is the predicted value (target variable).x is the input feature.m is the slope of the line (coefficient).b is the y-intercept (bias term). Using the above concept, linear regression algorithm aims to minimize the difference between the predicted values (y_pred) and the actual values (y_actual). This difference is measured using a loss function, typically the Mean Squared Error (MSE):
MSE = (1/n) Σ (y_actual - y_pred)²
Linear regression also uses optimization techniques like Gradient Descent to adjust the weights (w) and bias (b) iteratively to minimize the loss function.
Linear regression is considered an appropriate model for analyzing and predicting certain aspects of rape cases, particularly when the goal is to understand relationships between variables and predict trends. It is effective in identifying how factors such as socioeconomic conditions, population density, or education levels correlate with the number of reported cases. It can be used to forecast future trends in reported cases based on historical data, aiding in resource allocation and proactive planning. For example, if the model identifies a seasonal increase in cases law enforcement can focus efforts during those periods.
However, a limitation is that linear regression assumes a linear relationship between variables, which may not always hold true in complex crime data. It is also sensitive to outliers and struggles with multicollinearity or non-linear interactions. While linear regression is a good starting point for trend analysis and understanding general patterns, more advanced models like decision trees or random forests may be better suited for capturing complex relationships in rape case data with more informative and detailed data sets.
Python Library :
sklearn.linear_model 5. Time Series Forecasting Algorithm:
Time Series Forecasting is a type of predictive modeling technique used to predict future values based on previously observed data points over time. It is designed to handle data that is sequential and time-dependent, such as crime rates and the like. A time series forecasting algorithm analyzes patterns, trends and seasonality in the data to make accurate predictions about future values.
Time-Dependent Data: Time series data consists of observations recorded at regular intervals (e.g., daily, monthly, yearly).
Key elements of Time Series Forecasting :
Seasonality: Regular, repeating patterns in the data (e.g., higher sales during holidays).
Cyclic Patterns: Fluctuations that occur over irregular periods, often influenced by external factors (e.g., economic cycles).
Noise: Random variations or irregularities in the data.
AutoRegressive Integrated Moving Average is a type of TSA
AutoRegressive Integrated Moving Average : This is a TSA statistical model that combines autoregression , differencing and moving averages to model time series data.
Three key elements :
AutoRegressive: This is the relationship between an observation and a certain number of its previous observations (lags).
Integrated: This is the differencing of raw observations to make the time series stationary. But here, differencing involves subtracting the current observation from the previous one (or higher-order differences if needed).
Moving Average: This is the dependency between an observation and the residual errors (noise) from a moving average model applied to previous observations.
The ARIMA model is denoted as ARIMA(p, d, q), where:
p: The number of lag observations (autoregressive terms).d: The degree of differencing required to make the series stationary.
q: The size of the moving average window (number of lagged forecast errors).
Given all these details, ARIMA model might however fail to predict future rape cases effectively due to the complex and unpredictable naRture of the data itself. One major limitation is that ARIMA requires the data to be stationary, meaning the statistical properties like mean and variance should remain constant over time. However, rape case data is often non-stationary due to external factors such as social, economic and political changes, making it difficult for ARIMA to model accurately. Also, rape cases are influenced by complex relationships such as cultural norms, law enforcement policies and societal awareness, which ARIMA being a linear model cannot capture.
Furthermore, rape case data may exhibit irregular patterns or outliers, such as sudden spikes in reported cases due to high-profile incidents or media coverage, which can distort ARIMA’s predictions. The model is also better suited for short-term forecasting and becomes less reliable for long-term predictions, especially when underlying patterns in the data change over time. Issues like underreporting or inconsistent reporting of rape cases further complicate the data, leading to inaccurate forecasts. These limitations make ARIMA less effective for predicting future rape cases and alternative approaches, such as hybrid models or machine learning techniques may be better suited to handle the complexity and unpredictability of such data.
CASE STUDY ON REPORTED RAPE CASES IN INDIA
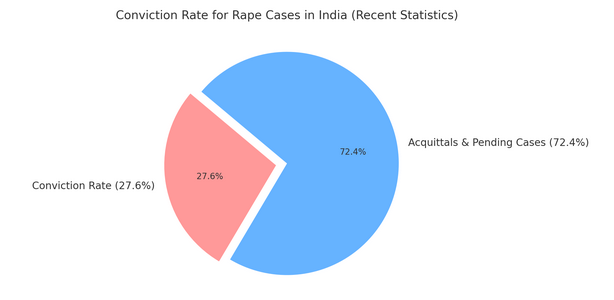
In this 21st century, alarmingly rape still remains a significant and deeply concerning issue in India, a country with a vast population and a prominent role on the global stage. It is one of the most prevalent crimes against women, with thousands of cases reported annually. According to the National Crime Records Bureau (NCRB), over 31,000 rape cases were registered in 2021, averaging 86 cases daily. This marked an increase from the previous year, highlighting the persistent nature of the problem. However, these numbers only represent reported cases, as many incidents go unreported due to societal stigma, fear of shame and mistrust in the legal system.

The issue of rape in India is deeply impacted by cultural and societal factors. Patriarchal norms, gender inequality and the stigma surrounding sexual violence often discourage victims from coming forward. Survivors frequently face societal ostracization and their families may prioritize reputation over justice. This creates an environment where perpetrators often go unpunished, further perpetuating the cycle of violence. High-profile cases such as the 2012 Delhi gang rape have sparked nationwide protests and brought global attention to the issue but they also underscore the systemic challenges in ensuring targeted 's safety.

India has made significant legal reforms in response to public outrage over such incidents. The Criminal Law (Amendment) Act of 2013 introduced stricter punishments including the death penalty for repeat offenders and established fast-track courts to expedite rape cases. Despite these measures, the judicial process remains slow and conviction rates are low leading to delayed or denied justice for many victims.
The impact of rape extends beyond the individual victim affecting families and society as a whole. Survivors often experience severe physical and psychological trauma, including depression while also facing societal exclusion. Public outrage over high-profile cases has led to widespread protests and demands for systemic change, but these movements also highlight the persistent challenges in addressing the root causes of sexual violence. Activists and organizations continue to push for better laws, improved law enforcement and societal transformation to ensure targeted victim's safety and dignity.
As one of the world's largest democracies and a key player on the global stage, India's handling of rape cases and targeted victims's safety is closely watched internationally. The issue impacts the country's global image and its commitment to human rights and gender equality. While legal reforms and public awareness campaigns have brought some progress, the persistence of such crimes underscores the need for continued efforts in law enforcement, judicial efficiency and societal change. Addressing rape as a crime in India is not only essential for protecting targeted groups but also for fostering a more equitable and just society.
Methodology :
This case study is conducted in two modules based on the data obtained from Govt. websites of India which records reported criminal statistics.
All data downloaded from Govt. of India statistics datasets available in https://www.data.gov.in/search?title=crime&type=resources&sortby=changed
The two objectives met through this case study would be : I. Designing a descriptive exploratory data analysis using various data visualization techniques such as line plots, bar plots, heat maps, KDE maps, etc. The dataset contains statewise yearly reported cases and conviction rates through 2018 to 2020. Primary focus is laid on the disparity in the conviction rates against reported cases.
II. Designing an accurate predictive model for predicting the likely total cases reported over the coming years based on a dataset which contains total reported cases (statewise) through 2016 to 2020. After negotiating over apt machine learning regressor models, linear regression algorithm has been chosen as the best candidate. This choice is also made deliberately based on the available dataset which is almost linear. The lack of complexity of the dataset and structured features in the dataset limited from applying models such as Random Forest, Decision Tree and Support Vector Machines. On a personal assessment, I believe Support Vector Machine would have been the ideal choice for a structured and layered dataset considering the sociological factors as well as psychological factors of the nature of this crime.
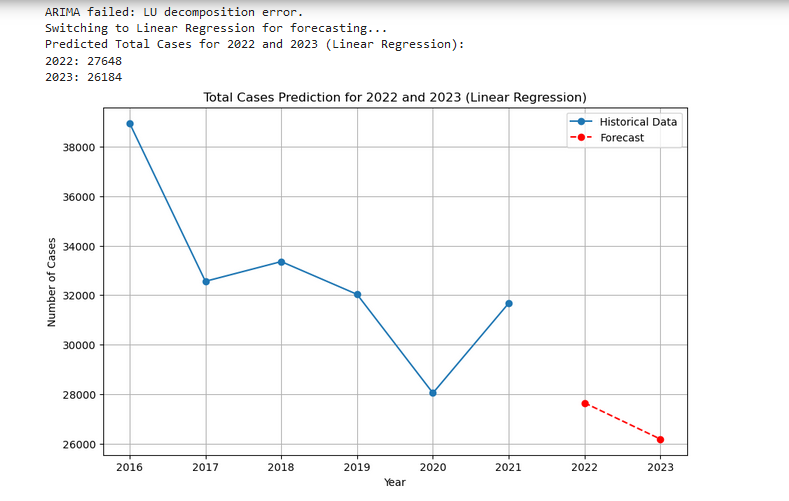
An approach using Time Series Forecasting has also been applied to the dataset using Auto Regressive Integrated Moving Average. The lack of sufficient data to identify the nature of data points (namely stationary or non stationary ) has resulted in the failure of Auto Regressive Integrating approach hence the optimized and final model was designed to fall back to an improved Linear Regression model which has generated the final prediction.
Data Visualization techniques have been thoroughly applied throughout the worksheet for better understanding and clarity of approaches.
Module I : Design a descriptive exploratory data analysis based on yearly reported cases and conviction cases (statewise)
This module intends a strategic approach to descriptive analysis to point out the disparity in conviction rates in comparison with reported cases. This has been implemented with the aid of various Exploratory Data Analysis techniques. The dataset collected from the official website of Govt. of India contains statewise/UT reported rape cases through 2018 to 2020 along with conviction rates.

The lack of structured data and simplified nature of dataset has been considered a limitation to any form of data analysis on these kinds of case studies. Sensitivity of rape cases could be a factor why publicly available information is limited. Another major setback was the non availability of important data points from major union territories in the dataset.

With an intent to base our analysis on reliable data, UT information had to be omitted from the final analysis in a later stage.
One huge relief observed in the analysis could be considered as the descent in total cases over the years.


The
states such as Madhya Pradesh, Rajasthan, Uttar Pradesh, Kerala and
Maharashtra has the higher number of rape cases reported over the
years with states namely Rajasthan and Uttar Pradesh yet struggling to make any major reforms to reverse the existing trend.
The States namely Kerala, Meghalaya, Nagaland and Punjab should be appreciated for implementing drastic reforms to reverse the existed situation.

Reduced conviction rates when compared to total reported cases has been an integral aspect of this analysis. For ease of comparison rate over the years were computed as the percentage attribute of total cases which in any assessed did not over throw more than the first quartile and stayed below this percentage which is an unfortunate reality to be coped with over the years (based on this sample).


This disparity of conviction rate in comparison with the total cases reported should be a strong topic of discussion as there is a clear problem observed there.
Based on the review, states which are in immediate need of reformative measures could be Rajasthan, Uttar Pradesh, Madhya Pradesh and Maharashtra. Another shocking trend could be the level of inconsistency in reported cases observed throughout the North Eastern parts of the country and its extended regions.

Howsoever, the descent in the total no. of cases reported over the years an overall relief from the assessment of available data.
Module II: Design an accurate predictive algorithm model based on yearly reported cases to discuss further on the discrepancies
This module primarily intends to predict the total number of cases based on an almost accurate prediction model designed using available apt supervised machine learning regressor algorithm. The best candidate chosen based on the available simplified non structured dataset which contained total reported cases through 2016 to 2020 would be Linear Regression algorithm.
A simple Linear Regression model was fit without passing any tuning parameters and a prediction model was designed to predict the total no. of cases in the coming three years aka 2021 to 2023.

One major drawback of the dataset and this analysis could be the compact and simplistic nature of the datapoints. Due to this lack of structuring and complexity in the dataset, more efficient models such as SVM and Decision Tree could not be applied to return more approximate prediction models.
That being cited, Indian Govt. should be appreciated for upholding the sensitive nature of rape crimes and handling the related statistics protected and highly confidential.
Acknowledgements has to be passed on to the Govt officials, owners of https://www.data.gov.in website and the law enforcement department of the Indian Govt.
[ References and Citations not added as this case study is not part of any official submission docs]